Taking Back My Data: Why I Ditched Strava Premium and Built My Own Fitness Dashboard
At the start of 2024, I committed to a more structured, intentional approach to fitness. I wrote about that shift in this post—how I rebalanced work, training, and health after years of background noise and distractions. That lifestyle change led to something else too: wanting more control over my data.
Table Of Content
Strava Premium had served its purpose. But by mid-2024, I was staring at the £6.99/month subscription fee thinking: I’m paying to access my own training data… and I can’t even customise it.
So, I ditched it.
Instead, I deployed Statistics for Strava, a brilliant open-source self-hosted dashboard built by Robin Ingelbrecht. It runs on my home server, behind Traefik, and it now handles all my training visualisation, gear management, and maintenance tracking—without the paywall.
Here’s how it works, what it looks like, and why it’s now one of my favourite parts of my fitness routine.
Why Self-Host?
Because I wanted:
Full ownership of my activity history
Better visibility into trends and progress
Gear tracking with proper usage and maintenance logs
Custom layouts and mobile-friendly tweaks
No more feature gating or subscription fees
I still use Strava to sync activities from Garmin—but now I control how I see and use that data.
The Project
🛠️ All credit to Robin Ingelbrecht, who built and maintains Statistics for Strava—a clean, fast, and open-source dashboard that pulls from the Strava API and runs beautifully in Docker.
It’s an absolute gift to data-driven athletes, and one of the best open-source tools I’ve come across.
What It Offers
📅 Monthly calendar view of your activities
📊 Weekly, monthly, yearly stats (distance, time, elevation)
🏅 Badges and PR tracking
🔁 Rewind feature for year-on-year comparisons
📷 Activity photos and route maps
🔥 Heatmaps by activity type
🛠️ Full gear and maintenance tracking
📲 PWA support and offline access
📸 Dashboard Overview
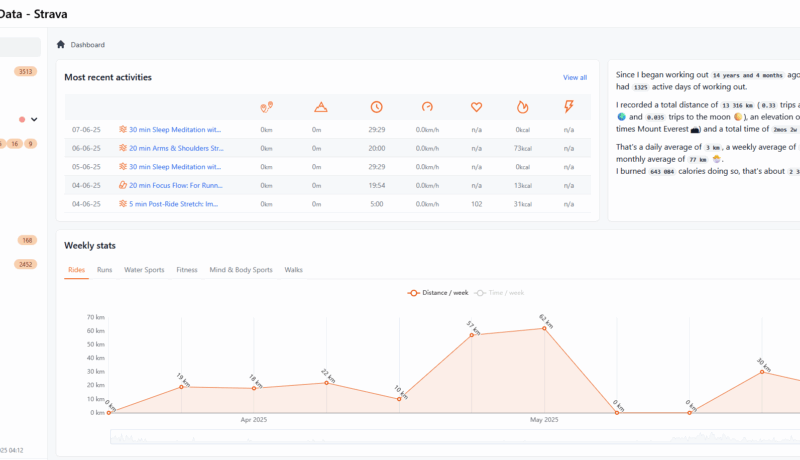
Here’s the central dashboard showing my recent activity overview, weekly totals, and training consistency.
[Insert Screenshot: Dashboard View]
Custom Gear & Maintenance Tracking
This is the killer feature for me. I track:
Peloton Bike+
Belt tension every 200km
Drivetrain clean every 500km
Peloton Tread
Deep clean every 100km
Deck bolts every 50km
SUP kit
Fin, leash, drybag rotation
Running trainers
Mileage and swap cycles
Hockey umpiring gear
Shoe changes, whistle batteries, etc.
Everything is logged per activity, with reminders when maintenance is due. No spreadsheet needed.
📸 Gear Maintenance in Action
[Insert Screenshot: Custom Gear Maintenance View]
My Setup: Dockerised and Customised
Here’s my live setup, running behind Traefik with persistent storage and custom layout overrides:
					services:
  strava:
    image: robiningelbrecht/strava-statistics:latest
    container_name: strava
    env_file: $DOCKERDIR/config/strava/.env
    volumes:
      - $DOCKERDIR/config/strava/config:/var/www/config/app
      - $DOCKERDIR/config/strava/gear/:/var/www/storage/gear-maintenance/
      - $DOCKERDIR/config/strava/.env:/var/www/.env
      - $DOCKERDIR/appdata/strava/build:/var/www/build
      - $DOCKERDIR/appdata/strava/storage/database:/var/www/storage/database
      - $DOCKERDIR/appdata/strava/storage/files:/var/www/storage/files
      - $DOCKERDIR/config/strava/templates:/var/www/templates
    networks:
      - t3_proxy
    security_opt:
      - no-new-privileges:true
    restart: unless-stopped
    healthcheck:
      test: ["CMD", "curl", "-f", "http://localhost:8080"]
      interval: 1m30s
      timeout: 10s
      retries: 3
      start_period: 30s
    logging:
      driver: json-file
      options:
        max-size: "10m"
        max-file: "3"
    labels:
      - "traefik.enable=true"
      - "traefik.http.routers.strava-rtr.entrypoints=websecure"
      - "traefik.http.routers.strava-rtr.rule=Host(`strava.$DOMAINNAME`)"
      - "traefik.http.routers.strava-rtr.middlewares=chain-no-auth@file"
      - "traefik.http.routers.strava-rtr.service=strava-svc"
      - "traefik.http.services.strava-svc.loadbalancer.server.port=8080"
Mounting the /templates folder means I can tweak how things look—mobile layout, dashboard order, colours. Fully mine.
📸 Segments and Efforts
All your efforts, all your PRs—filterable, sortable, visual.
[Insert Screenshot: Segments View]
📸 Year-on-Year Rewind
This feature compares your current year to previous ones. Perfect for spotting patterns or slumps.
[Insert Screenshot: Rewind / Year Comparison View]
📸 Sample Activity
Each activity has maps, stats, gear, weather, intensity… It’s all here.
[Insert Screenshot: Sample Activity View]
Pairing It with Garmin Connect
I use Garmin Connect for performance and recovery insights: heart rate variability, training load, VO2 max. But it’s not built for long-term review.
Statistics for Strava complements that perfectly:
It shows trends, volume, gaps, and consistency
It tracks kit usage and maintenance
It reminds me when gear needs love—not when it’s too late
The Result?
✅ No more Strava paywall
✅ Clean data visualisation
✅ Kit MOT built-in
✅ Total control, zero fluff
✅ Fits my training, my gear, my goals
And it all feeds into my lifestyle reset from 2024. This isn’t about chasing leaderboards—it’s about sustainable progress and knowing what’s going on.
Want to Try It?
Full credit to Robin Ingelbrecht for building this tool
Please share this article if you like it!
I’m a fitness enthusiast and Peloton addict who loves challenging limits through races, paddleboarding, and life’s adventures. Here, I share milestones, reflections on Acoustic Neuroma, and stories of resilience and growth.


No Comment! Be the first one.